Monday, May 20, 2024

An undergraduate who is an EKG tech sees something. The computer calls it completely normal. How about the physicians?

This was sent by an undergraduate (not yet in medical school, but applying now) who works as an ED technician (records all EKGs, helps with procedures, takes vital signs) and who reads this blog regularly.

He also sent me this great case.

Edited by Smith

A 63 year old man with a history of hypertension, hyperlipidemia, prediabetes, and a family history of CAD developed chest pain, shortness of breath, and diaphoresis after consuming a large meal at noon. 

He called EMS, who arrived on scene about two hours after the onset of pain to find him hypertensive at 220 systolic. 

He arrived to the ED at 1413, where his first EKG was taken (BP at this time was about 187/126):

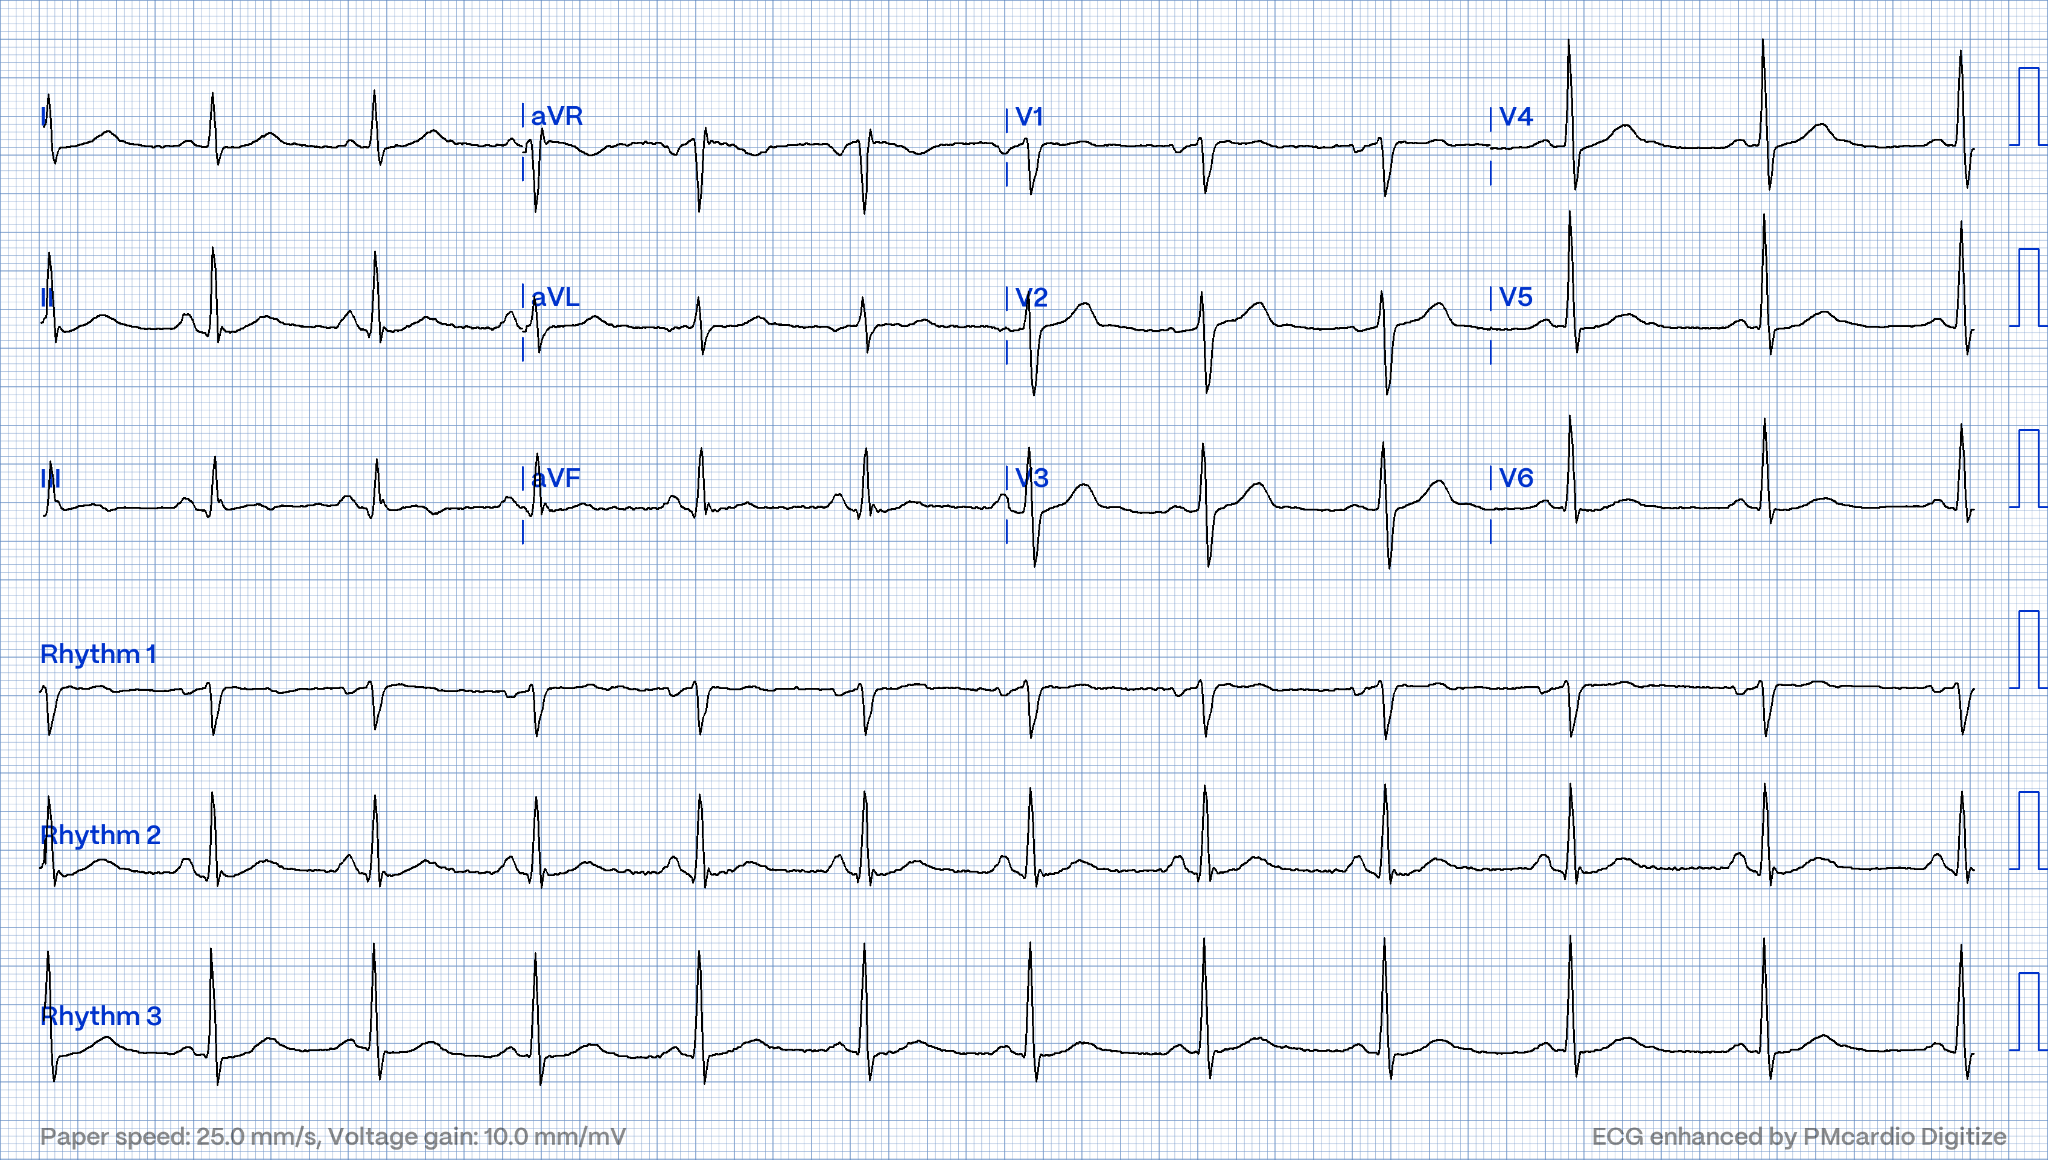
He recorded this ECG at 1413, with a BP of 187/126:

What do you think?


The undergraduate's analysis:

This EKG shows J point elevation of about 0.5-1 mm and ST segment straightening in lead III and reciprocal ST depression of about 0.5mm in aVL with a straight ST segment and a terminally upright T wave. Lead I also shows reciprocal ST depression. This EKG is diagnostic of transmural ischemia of the inferior wall. The conventional computer algorithm read “nonspecific ST-T wave abnormality”. 


Smith: note also the terminal QRS distortion in lead III (absence of S-wave without a prominent J-wave).


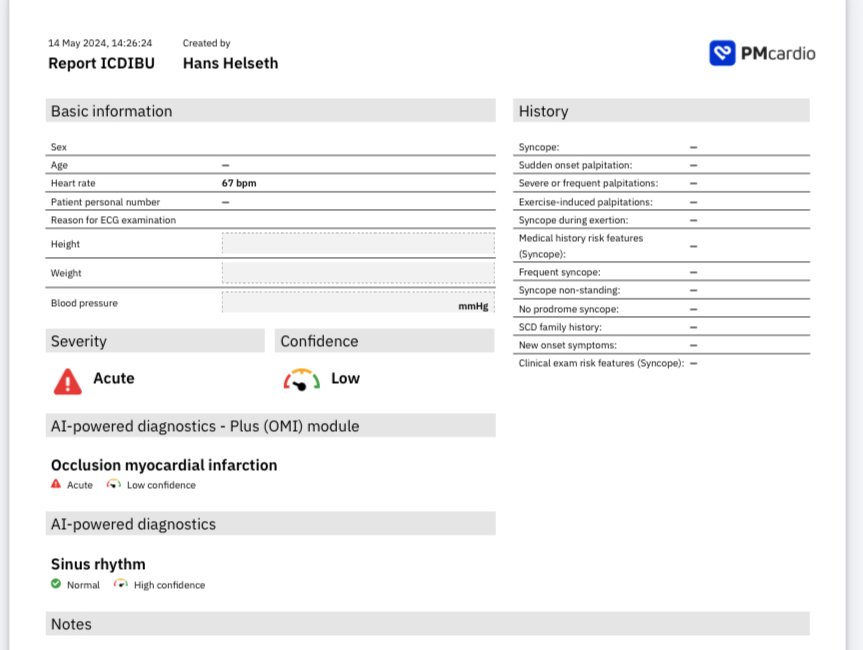
The Queen of Hearts disagrees with the conventional algorithm, diagnosing OMI with high confidence:


Case Continued:

The EKG was not immediately recognized by the emergency provider, who ordered a CT scan to rule out aortic dissection at 1419.  


The scan came back negative for acute aortic syndrome, but showed a “large amount of ingested material in the stomach” (probably the large meal the patient had before the chest pain began). The scan also showed “scattered coronary artery plaques”.

___________


Smith comment 1: the appropriate management at this point is to lower the blood pressure (lower afterload -- afterload increases myocardial oxygen demand, and lowering afterload decreases demand).  If it is angina, lowering the BP with IV Nitroglycerine may completely alleviate the pain and the (unseen) ECG ischemia.  If you are worried about aortic dissection, you also want the BP to be lowered, though you would do it first with esmolol to decrease the dP/dT (change in pressure over change in time).


Smith comment 2: I frequently see failure to control BP in patients with acute chest pain or acute heart failure.  In SCAPE (sympathetic crashing acute pulmonary edema), Emergency providers seem now to regularly give high dose NTG, but when the BP is 170/105 in a patient who is not crashing, we often fail to give something to lower afterload.

______________


Here are some Images:

The red circle shows the LAD coursing down the anterior interventricular sulcus. There is an area of dense white in the middle of the circle consistent with atherosclerosis. 


The green circle here shows a small section of the RCA. The blue circle shows the LCx. They too have dense white masses consistent with coronary atherosclerosis. 


Case Continued

The patient was brought back from the CT scanner with continued pain, and still appeared to be diaphoretic, short of breath, and in distress. 


The emergency provider ordered another EKG at 1446 (his blood pressure at this time was about 206/103):


This EKG shows evolution of continued transmural ischemia of the inferior wall. The T wave in lead III has increased in size. There is new ST segment flattening and T wave inflation in II and aVF. The reciprocal change in aVL has become more pronounced. The T waves in V2 and V3 are starting to “deflate” suggesting posterior wall involvement. 


This time, the conventional computer algorithm read:


 “Normal sinus rhythm, normal ECG”.


The Queen of Hearts once again diagnoses OMI with high confidence:


Click here to sign up for Queen of Hearts Access

The ED provider recognized the changes in this EKG and called cardiology for a STAT consult. The cardiologist recognized that there were EKG changes, but did not take the patient for emergent catheterization because the EKG was “not meeting criteria for STEMI”.


At 1502, the first high sensitivity troponin T resulted at 18 ng/L (very slightly elevated, the URL is 16 ng/L for men in this assay).


The patient was put on a nitroglycerin drip and his pain improved with his blood pressure.


At 1554, a third EKG was ordered (At this time, his blood pressure was around 122/57): 


This EKG shows changes consistent with reperfusion of the inferior wall. The T waves in leads II and aVF have deflated, and the T wave in lead III has become terminally negative. The ST depressions in I and aVL have resolved. 


Smith comment: Is the ACS (rupture plaque) with occlusion that is now reperfusing?  Or is it a very tight stenosis that does not allow enough flow to perfuse myocardium that has a high oxygen demand from severely elevated BP?


Transmural ischemia (as seen with the OMI findings on ECG) is not very common with demand ischemia, but is possible.  The only study I'm aware of that looked at this was mine, in which 4% of Type II MI had New ST Elevation. 

Smith SW.  Pearce LA.  Murakami MM. Apple FS.  Diagnosis of Type I vs. Type II Myocardial Infarction in Emergency Department patients with Ischemic Symptoms (abstract 102).  Annals of Emergency Medicine 2011; Suppl 58(4): S211.

____________________________

Amazingly, the Queen of Hearts still diagnoses OMI, although this time with low confidence:


Case Continued by the Undergraduate:


The cardiology fellow wrote in their note: “With initial troponin just minimally elevated and resolution of chest pain as well as EKG changes with normalization of blood pressure, we have lower suspicion for an acute ischemic event. However, in light of risk factors for atherosclerotic disease and dynamic EKG changes today, we will pursue a CTCA tomorrow for further evaluation of coronaries. 


It does appear more likely that his chest pain was GI in nature (possibly esophageal spasm and/or GERD) given his large meal preceding onset of chest pain, as well as CT findings consistent with large amount of ingested material in stomach.”


Smith: What???!!!


So the patient was admitted to the hospital with no plan for an angiogram. 


Then at 1935 when a 2nd troponin  resulted at 211 ng/L, and the patient received a diagnosis of “NSTEMI.”  At 0635 the next day, a third troponin resulted at 899 ng/L.  At 1041 a formal echo showed an EF of 71% and the note stated that the “basal posterior segment and and basal inferior segment are abnormal”. 


The cardiology fellow wrote in their note “unclear etiology of troponin elevation at this time, but hypertensive emergency, underlying CAD with demand ischemia, or NSTEMI all remain on the differential… In light of his risk factors, concerning clinical presentation and troponin trend -- we favor coronary angiogram over CTCA at this time.”


Of course, writing “hypertensive emergency, underlying CAD with demand ischemia, or NSTEMI all remain on the differential” makes no sense. Troponin was elevated and no “STEMI” was seen on the EKG, so if it is acute MI, then “NSTEMI” is the diagnosis (however flawed), not a pathology on the differential.  It is instead most likely that the patient has severe stenosis of the RCA (or possibly the LCx) and experienced such drastic hypertension that the demand could not be supplied by a severely stenosed artery, and resulted in findigs of transmural ischemia rather than subendocardial ischemia.  


Smith: 


After the blood pressure was controlled with nitroglycerin, the patient’s pain subsided and the EKG showed reperfusion. 


Was this resolution of demand ischemia?  Or was it spontaneous lysis of thrombus co-incidental with the lowering of the BP?


Probably the latter.


In any case, the appropriate intervention in this case begins with nitroglycerine, at whatever dose that it takes to lower the BP substantially.  


If the pain and ECG findings do not resolve, then the cath lab is indicated.  


Another EKG was taken at 1304:

This shows continued reperfusion and the development of large Q waves in lead III. 


The Queen of Hearts now sees no OMI with low confidence:


The patient did not receive an angiogram on day two of his hospitalization because the cath lab was too busy. Instead he had an angiogram at 0800 on day 3. 


The angiogram showed scattered mild luminal irregularities of the LAD, the LCx, and the RCA and a 95% distal RCA occlusion in a right dominant system. 


This was a presumed culprit and a stent was placed.  Assuming that was indeed a culprit, then this was ACS.  And angiographers tell me that it is sometimes difficult to say for certain based on angiogram alone, without intravascular ultrasound or, better yet, optical coherence tomography.


Read more about optical coherence tomography here.


A post-cath EKG was taken:

This EKG shows inferior Q-waves and T wave inversion in the inferior leads consistent with infarction and reperfusion of the inferior wall. The T waves in the anterior leads have become a bit “peaked” and symmetrical as well, which is a sign of reperfusion of the posterior wall.


The patient re-presented to the ED a few days after his discharge with syncope. Notably, he had a troponin T drawn at 1,524 ng/L, which is consistent with a large MI.  Most STEMI have peak troponin I over 1000 ng/L and most NSTEMI below that level.  Of course NSTEMI is a rather worthless diagnosis because it includes both OMI (very large MI) and Non-OMI (much smaller usually) 


He also had an echo done which showed persistent hypokinesis of the basal inferior wall segment and an EF of 60-65%. This suggests that during the time he spent in the hospital awaiting catheterization, he lost about 5-10% of his ejection fraction, though much of that may recover in the convalescent phase, which takes up to 8 weeks.


Click here to sign up for Queen of Hearts Access

Saturday, May 18, 2024

Early repol or anterior OMI?

Chest Pain – Benign Early Repol or OMI?

Written by Destiny Folk, MD, Adam Engberg, MD, and Vitaliy Belyshev MD


A man in his early 60s with a past medical history of hypertension, type 2 diabetes, obesity, and hyperlipidemia presented to the emergency department for evaluation of chest pain. He reported substernal chest pressure with radiation to his left arm that started at work several hours prior to arrival and had somewhat improved since onset. He noted that his father died from a heart attack in his early 50s prompting his presentation to the emergency department.

Here is the initial ECG at 13:17 with no prior ECG in the patient’s chart for comparison:

What do you think?


This is another version of the same ECG, lower quality, and with an additional filter applied. See Ken Grauer's additional comments about this ECG at the end of the post!


The ECG shows sinus rhythm and relatively normal QRS morphology. There are findings concerning for anterolateral OMI including ST elevation and hyperacute T waves in the anterolateral leads most prominent in V2-V5, as well as hyperacute T waves in the inferior leads. There is also abnormal R wave progression with regression from lead V2 to V3 (assuming normal leads). This ECG is highly concerning for LAD occlusion despite it not showing a STEMI criteria.

If you look at this and aren’t sure if this is normal variant ST Segment Elevation in V2-V4 (Early Repolarization) or a subtle LAD Coronary Occlusion, you can use Dr. Smith’s Simplified 4 Variable Formula:
--This formula can be applied to ECGs with some STE in leads V2-V4 (there should be at least 1 mm of STE in at least one of these 3 leads) 
--This formula considers:
1) the QTc (computer measurement)
2) the R-wave amplitude, in mm, in lead V4
3) ST elevation as measured at 60 milliseconds after the J-point, relative to the PR segment, in millimeters in lead V3. 
4) Lastly, the QRS amplitude in V2 (both the R- and S- waves) are measured. 

Using these measurements, the formula calculates a value. If that value is greater than 18.2, it is quite sensitive and specific for LAD occlusion.

You can find the variables used to calculate the value on MD calc here: https://www.mdcalc.com/calc/10079/subtle-anterior-stemi-calculator-4-variable


Utilizing Dr. Smith’s Subtle Anterior STEMI Calculator (4-Variable), the value is greater than 18.2 which is concerning for LAD occlusion. 
We measured:
1) QTc = 386 msec
2) QRS amplitude V2 = 12mm QRS in V2
3) R-wave amplitude V4 = 5mm 
4) STE 60 V3 = 2.0 mm STE at 60msec after J point in V3 
Formula value = 19.0.

The Queen of Hearts read this ECG as OMI – Low Confidence


Click here to sign up for QoH Access


The providers taking care of this patient were concerned regarding his clinical history and initial ECG, so they next performed a bedside cardiac ultrasound. POCUS showed an anterolateral wall motion abnormality with hypokinesis most pronounced at the apex.


Speckle Tracking Echocardiography may provide another useful adjunct. On the TEX Mindray machines, global longitudinal strain is defined as less than or equal to -16%. The Apical 4 Chamber best captured the significant wall motion abnormality to the apical anterior wall. The apical anterior and septal wall segments were identified with significant strain pattern as showed below in the bullseye diagrams:


Essentially speckle echocardiography is measuring how far 'pixels' of the myocardium are moving during cardiac cycles. A positive strain means elongation whereas a negative strain is shortening. On our ultrasound machine, the TEX, normal strain is considered -18 % and higher (more negative). The closer the number is to 0 the less the myocardial fibers are moving. The computer uses the three cardiac axes: (longitudinal, circumferential and radial.

Unfortunately, I only obtained 2/3 of the complete bullseye, which essentially maps out the myometrium with corresponding blood flow (see below). Vitaliy went back to see if he could add in the missing anterior lateral and inferior septal movement, but could not.

For this patient segments (7 and 13; anterior) and (14 and 8; anterior septal) show significant longitudinal strain with negative (less shortening than normal, i.e. not moving).

The graphic below correlates blood flow with the bullseye segments. Note the purple LAD supplies all the strain segments (7,8,13,14) The strain pattern corroborates the mid and distal LAD occlusion!!


The red circles correspond with the areas identified with significant cardiac strain. 

Dr. Smith and other authors showed the utility of Speckle Tracking Strain Echo in this case report: 


Repeat ECG:
Slightly less hyperacute T waves, likely indicating improving flow compared to the first ECG.


Several hours later, angiogram showed:
Culprit lesion mid LAD, 75% stenosis, TIMI 3, thrombotic, likely the source of the distal LAD 100% embolic occlusion, with TIMI 0 flow. The culprit mid LAD lesion was stented. It is not clear in the report whether thrombectomy was performed on the distal LAD occlusion.

Below is the ECG obtained after cath lab intervention:

Arrows demonstrate the reperfusion T waves.


This ECG is consistent with reperfusion given the T wave inversions shown in V2-V6 as indicated by the red arrows.

The patient’s hs troponin I rose from 1,709 to 24,860 ng/L, and was not trended to peak. The patient was discharged approximately 24 hours after intervention.

The discharge diagnosis was that worthless and meaningless term "NSTEMI".

The discharge diagnosis should have been "OMI"
 

Learning Points

The T waves should always be viewed in proportion to the QRS and if the T waves looks too big for the QRS, you should be concerned for OMI. T wave inversions in the OMI territory are consistent with reperfusion as shown below. T wave inversions may persist for days prior to the patient’s ECG returning to baseline.

Use the Subtle Anterior STEMI Calculator (4-Variable) to differentiate normal variant ST elevation (benign early repolarization) from anterior STEMI. This formula can be found on MD calc at this link: https://www.mdcalc.com/calc/10079/subtle-anterior-stemi-calculator-4-variable

Wall motion abnormality and Speckle Tracking can be a useful adjunct in corroborating subtle ECG findings.

QOH could have improved recognition of OMI in this case. 


===================================

MY Comment, by KEN GRAUER, MD (5/18/2024):

===================================
The "good news" about today's case — is that the treating clinicians promptly recognized ECG abnormalities in the initial tracing — documented abnormal Echo findings in support of suspected LAD OMI — and facilitated timely cardiac catheterization in which successful PCI led to a positive outcome.
  • I'll add some thoughts about the first 2 tracings in today's case.

Taking another look at the initial ECG (that I've reproduced in Figure-1) — this tracing is simply not easy to interpret. (NOTE: The ECG that I show below in Figure-1 is the only tracing that I initially saw — which illustrates the challenges of interpreting suboptimal quality tracings. I never saw the improved quality version).
  • There is a large amount of baseline artifact that complicates assessment of ECG #1. The underlying rhythm is sinus. That said — it took me a while to weed through the ever-present baseline undulations in this initial ECG, until I finally could recognize that a low-amplitude upright deflection (sinus P wavedoes consistently appear before each of the 10 QRS complexes in the long lead II rhythm strip.

  • The distracting effect of this artifact is perhaps best appreciated by looking at the different ST-T wave appearance for the 2 QRS complexes that we see in leads V2 and V3. The principal diagnostic consideration, is whether this initial ECG is diagnostic of acute LAD OMI — for which these 2 anterior leads provide key input. But — Which ST-T wave is the "correct" one? (ie, the ST-T wave of beat #6 in leads V2,V3 — or — of beat #7 in these leads)?

  • That said, there does appear to be a "culprit" extremity responsible for much (most) of the artifact — which appears to be coming from the RA extremity, because baseline undulations are maximal in leads I, II and aVR — present but smaller in leads aVL and aVF — and absent in lead III  (See My Comment at the bottom of the page in the February 18, 2024 post in Dr. Smith's ECG Blog for review of how to quickly determine the "culprit" extremity)Therefore — It's worth a quick look at the patient to see if the RA electrode might be loose? — or — if there might be any other potentially "fixable" patient action that might account for the artifact.

  • NOTE: The filter setting for this initial ECG in today's case — was 0.05-to-40 Hz (lower right portion of Figure-1). This setting is consistent with monitor mode — which is the setting often used to help reduce artifact and baseline wander. However, monitor mode is less precise for assessment of ST-T wave morphology — than the 0.05-to-150 Hz filter setting recommended for diagnostic mode.
  • Although clearly there are times when excessive movement artifact prevents use of the 0.05-to-150 Hz setting — it's good to appreciate the potential effect that filter settings may have, and best to first try the optimal 0.05-to-150 Hz setting when the focus is on ST-T wave analysis in a patient with chest pain (See My Comment in the January 13, 2024 post for more on filter settings).

ECG Findings in the Initial Tracing:
As per Drs. Folk, Engberg, Belyshev and Meyers — Even despite the artifact, ECG #1 is remarkable for hyperacute T waves in a number of chest leads — abnormal R wave progression — and a disproportionately large T wave in lead aVF.
  • KEY Point: For however much technical issues may have complicated assessment of chest lead morphology — I thought the abnormal limb lead findings in ECG #1 were convincing enough to convey that an acute process was in progress because: i) There could be no doubt about the disproportionate hypervoluminous appearance of the T wave in lead aVF (compared to the tiny QRS complex in this lead)ii) Although not elevated — the ST segment coving in lead III was clearly abnormal, and further supported the hyperacuity seen in neighboring lead aVF; andiii) The ST segment straightening with slight-but-real ST depression in lead aVL, in the context of this patient with new chest pain — satisfied the "magic" reciprocal ST-T wave appearance between leads III and aVL that so strongly suggests an OMI-in-progress.

  • Additional Point: Given the amount of artifact in ECG #1 — requesting an immediate repeat ECG might have clarified the ECG presentation.

Figure-1: The first 2 ECGs in today's case.


The Repeat ECG:
The 2nd ECG was recorded 25 minutes later.
  • The artifact is gone! Although there is baseline wander — the clear and consistent QRST complexes now enable precise interpretation.
  • In this patient with new CP (Chest Pain) — lead V3 immediately draws attention (within the RED rectangle in ECG #2— because of its hyperacute T wave (clearly taller and "fatter"-at-its-peak and wider at its base than it should be — given small size of the QRS in this lead).
  • In view of the abnormal T wave in lead V3 — the T wave in neighboring lead V4 is also hyperacute (more voluminous than it should be — within the BLUE rectangle in this lead).
  • The 3rd definitely abnormal (disproportionate) T wave in ECG #2 — is in lead aVF (within the BLUE rectangle in this lead).

IMPRESSION:
Realizing the technical difficulty inherent in assessing artifact-laden ECG #1 — there appears to be dynamic change compared to repeat ECG #2 done 25 minutes later.
  • The ST-T wave in lead V2 has normalized in ECG #2.
  • Although difficult to appreciate (because of the artifact in ECG #1) what may represent "real" change in leads V3,V4 between the 2 tracings — the T waves in leads V5,V6 clearly look less acute in the repeat tracing.
  • Subtle improvements are also noted in the limb leads of ECG #2. These include: i) Flattening of the ST segment in lead III in the repeat tracing; ii) Resolution of the slight ST depression in lead aVL; andiii) Reduced relative size of the hyperacute T wave in lead aVF.

  • BOTTOM Line: In this high-prevalence for OMI patient with new CP — these 2 serial ECGs are diagnostic of acute LAD OMI, with need for prompt cath confirmed by dynamic ST-T wave changes between the 2 tracings. IF symptoms were decreased at the time (25 minutes later) when ECG #2 was obtained — the improvement we see in ECG findings between these 2 tracings would suggest spontaneous reperfusion of the "culprit" artery was beginning.


Wednesday, May 15, 2024

Crushing Chest Pain and Can't see OMI on the ECG? Just give morphine, right?

Submitted anonymously, written by Willy Frick

A man in his late 30s with a 10 pack-year smoking history presented with acute substernal chest pressure radiating into his left shoulder with associated nausea, vomiting, and diaphoresis which began suddenly while he was getting ready for work. He described it as feeling like "a bulldozer on [his] chest." He rated it 10/10 intensity.

With no additional information, the HPI puts this patient at very high pre-test probability of OMI.

ECG 1

What do you think of his presenting ECG?


Queen of Hearts interpretation with explainability:


Although it is not apparent from this ECG by itself, there is actually LA-LL reversal here. LA-LL reversal is usually identified by P wave in lead I which is larger than in lead II. In this case, it is clear only from comparison to subsequent ECGs. LA-LL reversal causes the following:
  • I and II switch places
  • aVL and aVF switch places
  • III is inverted
Below is what it looks like after correction.

ECG 1 (corrected)


Remember that for patients at very high pre-test probability of OMI, you have to rule it out regardless of the ECG. Remember that the European guidelines recommend immediate angiography for refractory chest pain. Remember that such patients ACTUALLY get such guideline appropriate therapy only 6.4% of the time.

Knowing that the patient is probably having an OMI, we see what might be hyperacute T waves inferiorly. An even stronger clue is the extremely subtle downsloping depression in aVL. I do not think anyone could call this ECG diagnostic for OMI. But it is very suspicious.  The patient was still in the waiting room at this time. No labs were drawn, but he had the following repeat ECG 25 minutes after the first.

ECG 2, t + 25 minutes

What do you think?

Here are some of the key leads shown side-by-side for serial comparison, ECG 1 (corrected) on the left, ECG 2 on the right.


We appreciate the following changes:
  • Correction of the LA-LL reversal (although it would be within reason to wonder if this is actually the reversed tracing, since P in lead I is larger than in lead II).
  • There is slightly more STE in III.
  • The subtle STD in aVL is slightly more pronounced. Even more worrisome, it has the (inverted) coved appearance which is highly concerning for ischemia.
  • Lead I is also beginning to show reciprocal depression.
  • The J point in V3 which was previously about 1.5 mm elevated (which is normal) is now abnormally isoelectric. Stated differently, it is now relatively depressed, suggestive of posterior extension.

Case Continued

Unfortunately, these changes were not appreciated, and the patient remained in the waiting room for the next several hours. High sensitivity troponin I drawn around the time of ECG 2 was 13 ng/L (ref. ≤ 35). Repeat troponin about two hours later was 44 ng/L. This confirms the diagnosis of MI which requires 1. dynamic troponin elevation, and 2. signs or symptoms of ischemia.

I sent this 2nd ECG to our "ECG Nerdz" group without any clinical information and the response was immediately "Inferior OMI"

Unfortunately, although it is diagnostic, in this case the Queen of Hearts stated "Not OMI with High Confidence"

The patient was roomed at t + 4 hours. The ED physician documented that the patient was complaining of 8/10 chest pain. The ED physician's note included a differential diagnosis with ACS listed as the first possibility. He was given famotidine 20 mg IV, morphine 4 mg IV, and SL NTG. Giving morphine to suspected ACS without activating lab is like removing the batteries from the alarming carbon monoxide detector and staying in the house.

The patient went for CT angiogram to rule out aortic dissection. Eagle-eyed readers may notice something the radiologist overlooked. (Answer at the end of the case.)


Repeat hsTnI at t + 5 hours was 244 ng/L, at which time cardiology was consulted. After evaluating the patient who had ongoing pain, cardiology recommended admission and planned catheterization after the weekend. (This was Friday afternoon.) A fourth troponin at t + 6 hours was 608 ng/L.

Around this time, the patient was redistributed from the cardiology consult service to the admitting service. 

The cardiologist on the admitting service is a reader of Dr. Smith's ECG Blog. When he heard about the case, he immediately evaluated the patient who told him he had severe, persistent chest pain. At that point, the cardiologist activated the cath lab. His angiogram is shown below:


Here is a representative still. The red arrow head points to the LADgreen to a very high OM (or Ramus Intermedius if you prefer), and orange to LCx.


The cardiologist noted that, aside from a mid left circumflex occlusion with TIMI 0 flow (meaning absolutely no flow beyond the occlusion), the remaining coronary arteries appeared normal. After aspiration thrombectomy, he confirmed absence of coronary plaque using intravascular ultrasound. He therefore did not place a stent.

After PCI, troponin rose from 608 to 37,186 ng/L, a huge infarct. Echocardiogram showed LVEF 42%, akinetic inferior wall, hypokinetic inferolateral wall leaving this patient with heart failure while in his 30s.

Door-to-balloon time was 10 hours and 50 minutes. The patient infarcted his inferior and inferolateral walls in the ED of a hospital with a cath lab.

He was worked up for sources of embolism.

Shown below is TEE, mid-esophageal 2-chamber view zoomed in on the mitral valve.


Here is a still shot with a red circle showing a mass concerning for vegetation.


Dental x-rays showed caries and missing teeth. All blood cultures and serologies were negative, and he was treated for 6 weeks with broad spectrum antibiotics for culture-negative endocarditis.

ECG 3 was obtained 2 days after PCI


We see the following:
  • New inferior Q waves
  • Terminal TWI in III and aVF due to reperfusion
Learning Points:
  • OMI is a clinical diagnosis.
  • A "negative" ECG does not rule out OMI.
  • A normal troponin does not rule out OMI.
  • The CTA in this case actually showed OMI. Note that the inferoposterior wall does not take up contrast.
  • Medically refractory chest pain needs immediate angiography.
  • In this patient's case, the diagnosis was immediately obvious from presentation, but the physicians who saw him were falsely reassured by ECG and troponin.

Recommended Resources